Troubleshooting
remove-background
Feel free to check the issues on github, where there are several answered questions you can search through. If you don’t see an answer there or below, please consider opening a new issue on github to ask your question.
FAQ
What are the “best practices” for incorporating CellBender into my analysis pipeline?
Does CellBender work with CITE-seq data? Or other non-“Gene Expression” features?
Could I run CellBender using only “Gene Expression” features and ignore other features?
Could I run CellBender using only “Antibody Capture” features and not Gene Expression?
Where can I find the ambient RNA profile inferred by CellBender?
The PCA plot of latent gene expression shows no clusters or structure
The learning curve looks weird. / What is the learning curve supposed to look like?
What is the “metrics.csv” output for, and how do I interpret the metrics?
My HTML report summary (at the bottom) said there were some warnings. What should I do about that?
I ran the WDL in Terra and the job “Failed” with PAPI error code 9
Answers / Troubleshooting Tips
What are the “best practices” for running the tool?
See the recommended best practices
What are the “best practices” for incorporating CellBender into my analysis pipeline?
See the proposed pipeline
How do I load and use the output?
The data can easily be loaded as an
AnnDataobject in python, to be used inscanpy, or it can also be loaded by Seurat, see the example hereWe recommend loading the input and output data (together) using the function
cellbender.remove_background.downstream.load_anndata_from_input_and_output()from the CellBender package, since that will create anAnnDatawith separate layers for the raw data and the CellBender output data. This is quite handy for downstream work. There are several simple data-loading functions incellbender.remove_background.downstreamthat might be useful.
from cellbender.remove_background.downstream import load_anndata_from_input_and_output

adata = load_anndata_from_input_and_output(input_file='tiny_raw_feature_bc_matrix.h5ad',
                                           output_file='tiny_output.h5')
adata
AnnData object with n_obs × n_vars = 1000 × 100
    obs: 'background_fraction', 'cell_probability', 'cell_size', 'droplet_efficiency', 'n_cellranger', 'n_cellbender'
    var: 'ambient_expression', 'features_analyzed_inds', 'feature_type', 'genome', 'gene_id', 'n_cellranger', 'n_cellbender'
    uns: 'cell_size_lognormal_std', 'empty_droplet_size_lognormal_loc', 'empty_droplet_size_lognormal_scale', 'posterior_regularization_lambda', 'swapping_fraction_dist_params', 'target_false_positive_rate', 'fraction_data_used_for_testing', 'test_elbo', 'test_epoch', 'train_elbo', 'train_epoch'
    obsm: 'cellbender_embedding'
    layers: 'cellranger', 'cellbender'
What are the details of the output h5 file format?
Do I really need a GPU to run this?
It’s not absolutely necessary, but the code takes a long time to run on a full dataset on a CPU.
While running on a GPU might seem like an insurmountable obstacle for those without a GPU handy, consider trying out our workflow on Terra, which runs on a GPU on Google Cloud at the click of a button.
Others have successfully run on Google Colab notebooks for free. Since CellBender produces checkpoint files during training (
ckpt.tar.gz), you can even pick up where you left off if you get preempted. You just need to put theckpt.tar.gzfile in the directory where the CellBender command is being invoked (or specify the file using the argument--checkpoint), and CellBender will automatically pick up where it left off when the same command is re-run.If you really want to use a CPU only, then consider things that will speed up the run, like using fewer
--total-droplets-included, and increasing the threshold--projected-ambient-count-thresholdso that fewer features are analyzed, and maybe decreasing--empty-drop-training-fraction, so that each minibatch has fewer empty droplets.
How do I determine the right
--fpr?See the recommended best practices
How do I determine the right
--expected-cells?See the recommended best practices
How do I determine the right
--total-droplets-included?See the recommended best practices
Does CellBender work with CITE-seq data? Or other non-
Gene Expressionfeatures?Absolutely, as shown here and in our paper. The results for
Antibody Capturedata look even better than for gene expression, due to the higher ambient background for that modality.ATAC data is a bit more tricky. CellBender will run, though it takes a long time with 200k+ Peak features. You can use the argument
--projected-ambient-count-threshold 2to tell CellBender to ignore all features which are not estimated to have at least two noise counts in cells. This can greatly speed things up. Feel free to experiment with that value. Anecdotally it seems that ATAC data is less noisy than gene expression data to begin with, so some users opt to have CellBender ignore the ATAC features using the input argument--exclude-feature-types Peaks. There is nothing wrong with doing this. The CellBender output file will still contain the ATAC Peak features, but they will be identical to the raw input file.
Could I run CellBender using only
Gene Expressionfeatures and ignore other features?If you want to, you can (though it works great with
Antibody Capturedata): just use the--exclude-feature-typesinput parameter.
Could I run CellBender using only
Antibody Capturefeatures and notGene Expression?No, it is not a good idea to exclude
Gene Expressionfeatures for the following reason: theGene Expressionfeatures form the basis of a good prior on “cell type”, which the method heavily relies on to denoise. Other features, withoutGene Expression, are probably too sparse to cluster similar cells together and form a good prior for “which cells are similar to which others”.
Where can I find the ambient RNA profile inferred by CellBender?
This is present in the output h5 file as the field called
/global_latents/ambient_expression(see here). If you use the dataloader fromcellbender.remove_background.downstream(see here), then the ambient expression profile will be loaded into the AnnData object asadata.var['ambient_expression'](Though it is referred to here as “ambient RNA”, all features are included, not just Gene Expression.)
The code completed, but how do I know if it “worked”? / How do I know when I need to re-run with different parameters?
The vast majority of runs using a nice dataset will work just fine. If your dataset might not be so “nice”, then we recommend taking a look at the output
_report.html, which will have a few diagnostics and will issue warnings and recommendations as appropirate.In general, if the learning curve (ELBO versus epoch) has huge spikes, or if if does not converge near the end but rather dips back down, then you may need to consider re-running with a lower
--learning-rate. The solution is typically to reduce the--learning-rateby a factor of two.In certain cases, it may be obvious that CellBender has failed to call cells accurately. In these cases, it may be necessary to do a bit of experimentation with
--expected-cellsand--total-droplets-includedto try to guide CellBender toward a more reasonable solution. It has been our observation that such cases are relatively rare. Try looking at the UMI curve and picking a value for--expected-cellswhere you know that all the droplets preceding that number are surely cells.
It seems like CellBender called too many cells
Did it?
remove-backgroundequates “cell probability” with “the probability that a given droplet is not empty.” These non-empty droplets might not all contain healthy cells with high counts. Nevertheless, the posterior probability that they are not empty is greater than 0.5. The recommended procedure would be to filter cells based on other criteria downstream. Certainly filter for percent mitochondrial reads. Potentially filter for number of genes expressed as well, if this does not lead to complete loss of a low-expressing cell type.Experiment with increasing
--total-droplets-included.Experiment with increasing or decreasing
--empty-drop-training-fraction.As a last resort, try decreasing
--expected-cellsby quite a bit.
It seems like CellBender called too few cells
If CellBender seems to have missed cells, or if you get a “No cells found!” error, then try increasing
--expected-cells, and also ensure that your value for--total-droplets-includedis large enough that all droplets after this value on the UMI curve are “surely empty”.
The PCA plot of latent gene expression shows no clusters or structure
Has training converged? Training should proceed for at least 150 epochs. Check to make sure that the ELBO has nearly reached a plateau, indicating that training is complete. Try increasing
--epochsto 300 and see if the plot changes.This is not necessarily a bad thing, although it indicates that cells in the experiment had a continuum of expression, or that there was only one cell type. If this is known to be false, some sort of QC failure with the experiment would be suspected. Perform a downstream clustering analysis with and without
cellbender remove-backgroundand compare the two.
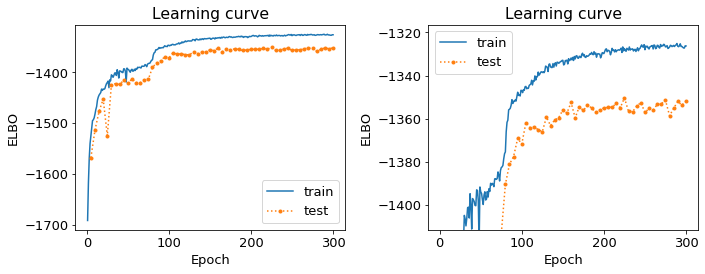
The learning curve looks weird. / What is the learning curve supposed to look like?
The “learning curve”, a.k.a. the plot of ELBO (evidence lower bound) verus training epoch, is a record of the progress of inferring all the latent variables in the CellBender model, based on data. This learning happens via gradient descent. Typically, the ELBO changes gradually, increasing and approaching some rather stable value by the end of training. Ideally, the ELBO increases monotonically.
If the learning curve either starts decreasing, or has a large downward bump or a downward spike or spikes, then something may have gone a bit “off the rails” during training. We would be concerned that, for example, the inference procedure got thrown off into some local minimum that is sub-optimal. If you see a learning curve that looks strange, then try to re-run with half the
--learning-rateand see if it results in a more “canonical” learning curve. If it does, use that output.Examples: 2 fine learning curves (panels on right are zoomed-in y-axis)

Examples: 2 bad learning curves

What is the
metrics.csvoutput for, and how do I interpret the metrics?This is a bit of a niche output, and most people can ignore it if they want to. The idea here is to enable automated analysis pipelines to make decisions about whether to re-run CellBender with different parameters. Several of the output metrics contained here are also contained in the HTML report (though not all). But, importantly, this CSV file is easy to parse programmatically, so that a pipeline can make automatic decisions. All metrics are scalar quantities, and the intent was to name them so they are self-explanatory. The contents are:
total_raw_counts: Sum of all input count matrix entriestotal_output_counts: Sum of all output count matrix entriestotal_counts_removed: 1 minus 2fraction_counts_removed: 3 divided by 1total_raw_counts_in_cells: Same as 1, but calculated only in CellBender- determined non-empty dropletstotal_counts_removed_from_cells: 5 minus 2 (since only cells have nonzero counts in the output)fraction_counts_removed_from_cells: 6 divided by 5average_counts_removed_per_cell: 6 divided by the number of CellBender- determined non-empty dropletstarget_fpr: The input--fprvalueexpected_cells: The input--expected-cellsvalue, blank if not provided.found_cells: The number of CellBender- determined non-empty dropletsoutput_average_counts_per_cell: 2 divided by 11ratio_of_found_cells_to_expected_cells: 11 divided by 10found_empties: The number of empty droplets, as determined by CellBender. This number plus 11 equals the input--total-droplets-included(or the value used by default)fraction_of_analyzed_droplets_that_are_nonempty: 11 divided by the input--total-droplets-includedconvergence_indicator: The mean absolute difference between successive values of the train ELBO for the last 3 epochs, divided by the standard deviation of the train ELBO over the last 20 epochs. A smaller number indicates better convergence. It’s typical to see values of 0.25 or 0.35. Large values might indicate a failure to converge. (Not many people have yet used this in practice, so we might learn more about recommendations in future.)overall_change_in_train_elbo: The change in ELBO from first to last epoch.
The most useful values for automated decision-making are probably 13, 15, and 16.
My HTML report summary (at the bottom) said there were some warnings. What should I do about that?
If the warning comes with a recommendation to re-run with different settings, then that is worth a try.
Some warnings do not need further action, and simply reflect peculiarities of the specific dataset.
The tool failed to produce an HTML report
Please report the error as a github issue. The report-making process, since it makes use of Jupyter notebooks, is a bit of a fragile process. These reports are new in v0.3.0, and there has been less testing.
I ran the WDL in Terra and the job
Failedwith PAPI error code 9Typically this is a so-called “transient” error, meaning that it was a random occurrance, and the job may succeed if run again without any changes. However, it is worth checking the log and checking “Job Manager” to see if there was a more specific error message.
How much does it cost, per sample, to run the WDL in Terra?
It depends on the size of the dataset, but $0.30 is pretty typical, as of the pricing used by Google Cloud in July 2022.
I am getting a GPU-out-of-memory error (process
Killed)Please report the issue on github, but there are a few things you can try to reduce memory usage. Typically memory usage is highest during posterior sampling. Try setting
--posterior-batch-sizeto 64, instead of its default value of 128. (Make sure to restart from the checkpoint file to avoid re-running inference. This will happen automatically if you re-run in the same folder as theckpt.tar.gzfile.)If you can, try running on an Nvidia Tesla T4 GPU, which has more RAM than some other options.
Currently, CellBender only makes use of 1 GPU, so extra GPUs will not help.
I got a
nanerror and the tool crashedThis is real bad. Definitely report this issue on github. You may be asked to re-run the tool using the
--debugflag, to get more error messages for reporting.
There was an error!
Please report the issue on github. You may be asked to re-run the tool using the
--debugflag, to get more error messages for reporting.The following warning is emitted in the log file: “Warning: few empty droplets identified. Low UMI cutoff may be too high. Check the UMI decay curve, and decrease the
--low-count-thresholdparameter if necessary.”This warning indicates that no “surely empty” droplets were identified in the analysis. This means that the “empty droplet plateau” could not be identified. The most likely explanation is that the level of background RNA is extremely low, and that the value of
--low-count-thresholdexceeds this level. This would result in the empty droplet plateau being excluded from the analysis, which is not advisable. This could possibly be corrected by decreasing--low-count-thresholdto a value like 1.