Changelog
CellBender has been publicly available since 2019, and there have been some significant changes over the years. Major changes and updates are denoted by a change in the (first or) second digit of the version number. For example, major changes were made between version 0.1.0 and 0.2.0. Small changes, edge case bug fixes, speedups, and small new features might bump up the last digit of the version number. For example, the difference between 0.2.1 and 0.2.0 represents this kind of small change.
Version 0.3.2
Small improvements aimed at reducing memory footprint, along with bug fixes.
Improvements:
Make posterior generation more memory efficient
New features:
WDL workflow updates to facilitate automatic retries on failure
Added to list of allowed feature types to match 2024.04 CellRanger definitions
Bug fixes:
Fix bug with MTX inputs for WDL
Fix Windows bug during posterior generation
Fix report generation bugs on Mac and Windows
(Version 0.3.1 – redacted)
WARNING: redacted
If you managed to obtain a copy of v0.3.1 before it was redacted, do not use it. An integer overflow bug caused outputs to be incorrect in nearly all cases. For more information, see github issue 347 here.
Version 0.3.0
Further significant changes were made to the way the output count matrix gets computed. We compute a budget of noise counts for each gene individually, and partition those noise counts in a way that optimizes the posterior probability of our model. This involves solving an auxiliary optimization problem.
The input arguments --expected-cells and --total-droplets-included, which
have always been required for the tool to work reliably, are now much more
optional. Extensive testing has shown that these arguments can be left out the
vast majority of the time, making things easier on users.
A great amount of effort has been put into refinements which reduce the failure rate on difficult samples.
Output data loading functions in python have been distributed with the CellBender codebase in order to facilitate downstream data loading and use in scanpy.
In addition, the code produces checkpoints at timed intervals, and these checkpoints can be used to deterministically pick up where the code left off. This is extremely advantageous in cloud compute settings, and was built with Terra in mind. The checkpointing functionality, together with the re-written WDL workflow, allow the workflow to be run seamlessly on preemptible GPU instances, which are a fraction of the cost of non-preemptible machines. We also hope these checkpoints make it easier to run a workflow using Google Colab on a GPU for free.
Produces checkpoint files, and the WDL can run seamlessly on preemptible GPUs
Computes the “denoised” count matrix by solving an auxiliary optimization problem
We demonstrate that this approach is superior to v0.2.0 in the publication
Several tweaks to the inference procedure lead to speedups and better performance on benchmarks
The tool produces an output report in HTML format with plots, analysis, commentary, warnings, and recommendations
A
metrics.csvoutput file is produced for those interested in running hundreds of samples in automated pipelines. This file can be parsed to look for indications that a sample may need to be re-run.
Version 0.2.0
A significant overhaul of the model and the output generation procedure were undertaken to explicitly guarantee that CellBender only subtracts counts and never adds. The output is not constructed by imputation or smoothing, and CellBender intentionally tries to modify the raw data as little as possible in order to achieve denoising. A nominal false positive rate is approximately controlled at the level of the entire dataset, to prevent removal of too much signal.
Uses a variational autoencoder as a prior
Computes the “denoised” count matrix using a MAP estimate and posterior regularization
CellBender never adds counts
Version 0.1.0
This was the initial release. The output count matrix was constructed via imputation, so that there were no explicit guarantees that CellBender would only subtract counts and never add.
This version has been deprecated, and we do not recommend using it any longer.
Imputes the “denoised” count matrix using a variational autoencoder
Human-mouse mixture benchmark
The human-mouse mixture dataset from 10x Genomics is a great dataset for benchmarking noise removal methods.
Figure legend:
Log-log plot of counts of human genes versus mouse genes in each cell. Each cell is a dot. Gray dots are the raw data, same in each figure. Green dots are the CellBender output at FPR 0.01. Marginal histograms are shown above and to the right.
Quantification of cross-species contamination per cell. Blue boxes show human genes in mouse cells, and orange boxes show mouse genes in human cells.
Quantification of overall count removal per gene. Each dot is a gene, summed over all cells. X-axis is the raw data. Y-axis is the fraction of counts remaining after CellBender noise removal. This is not a comparison with truth, but rather a look to see if high-count or low-count genes are being treated differently with regard to noise removal. The red line guides the eye for what would be a constant level of removal.
This benchmark is not shown for v0.1.0, as it is deprecated.
v0.2.2
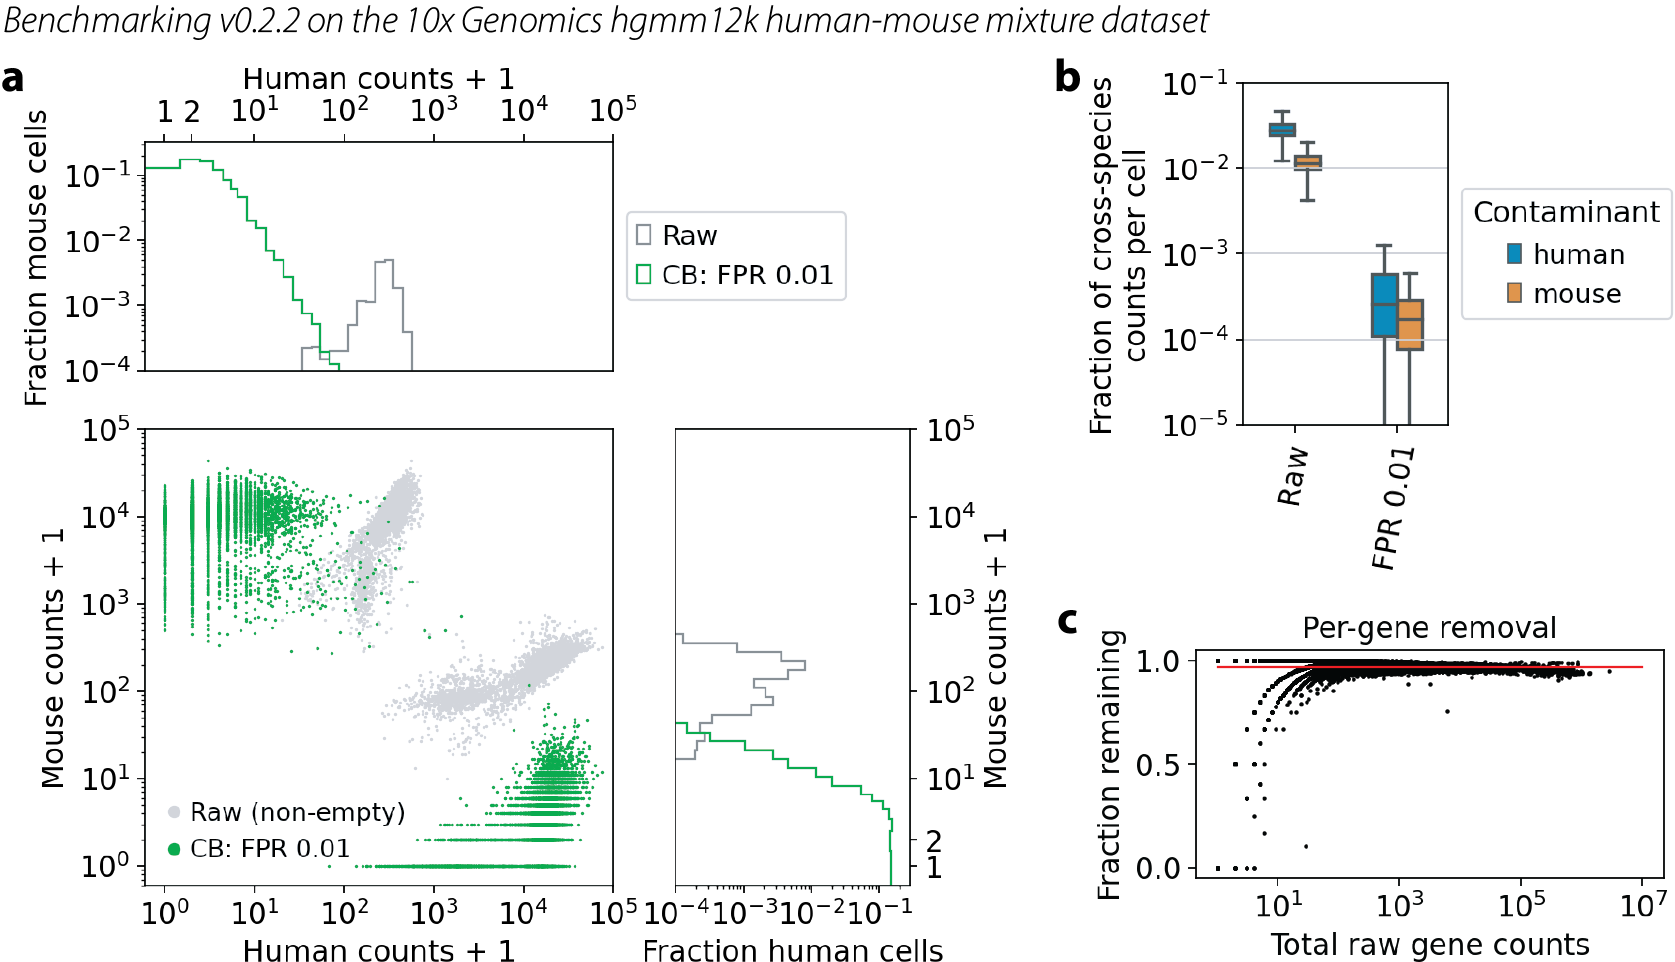
Note that the very small dip in panel c for genes with raw counts > 1e5 indicates some over-removal of highly expressed genes. (Some of the mass of black dots is dipping below the red line.)
Nature Methods publication
The code run in the paper is technically v0.3.0_rc, a “release candidate”. The results are shown in the paper in Figure 5a, and reproduced here in a comparable format.
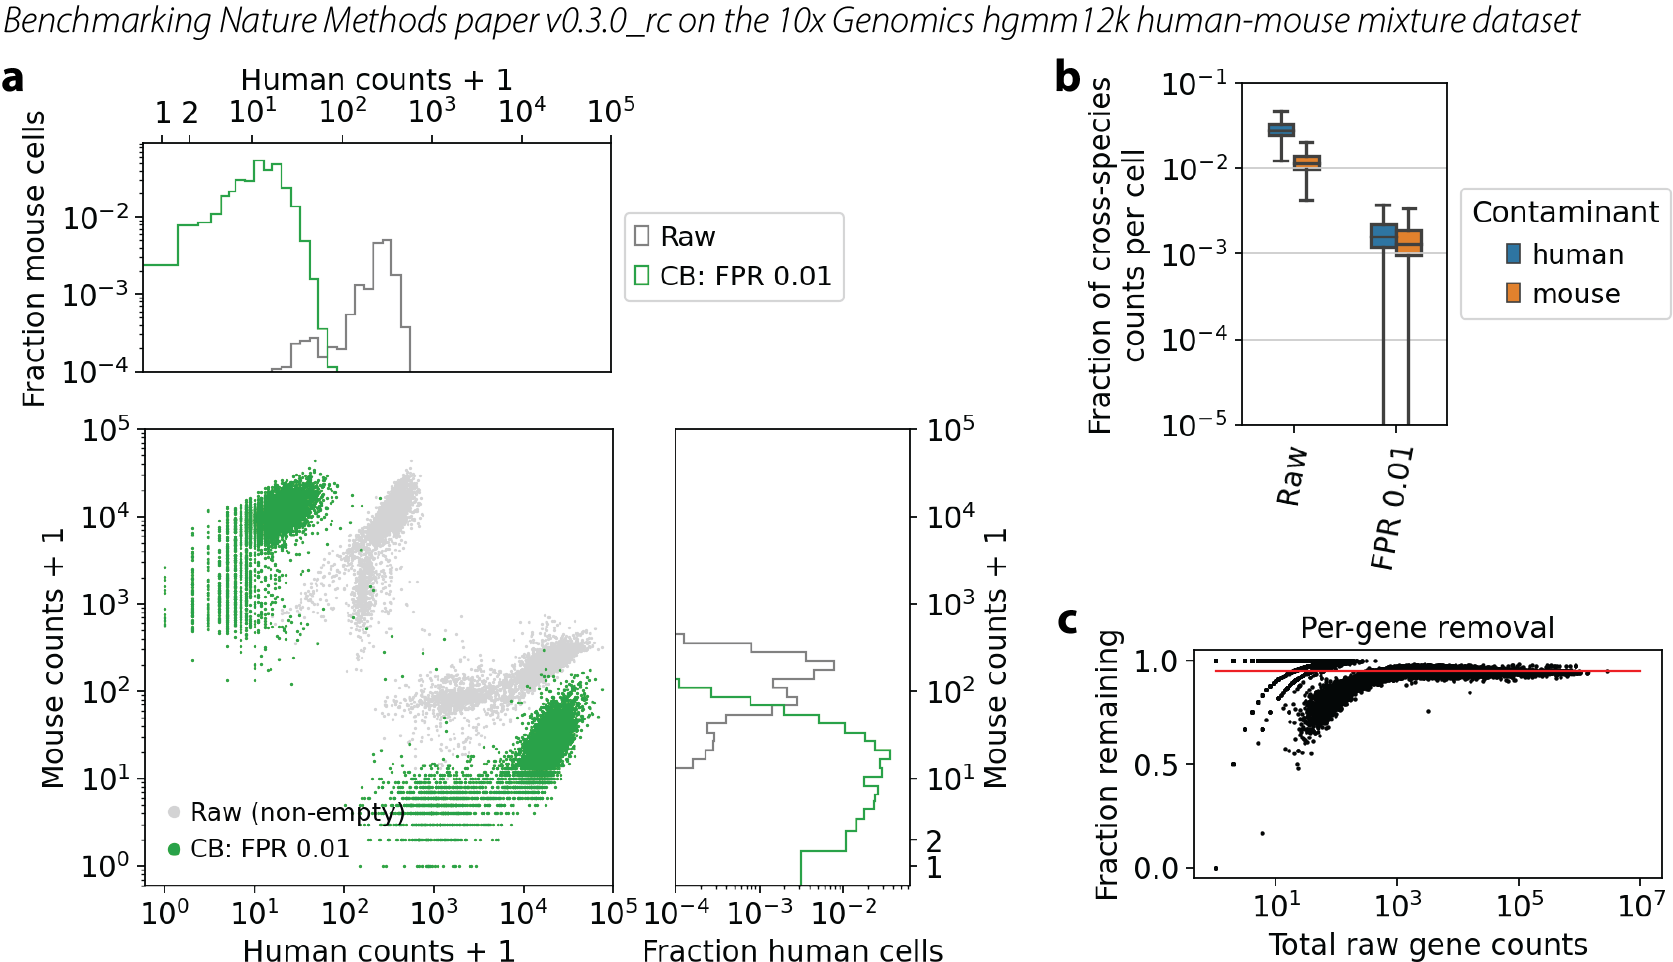
Note that the seeming performance regression came with a lot of extra guarantees about the quality of the output. The dip visible in panel c in v0.2.2 has disappeared.
v0.3.0
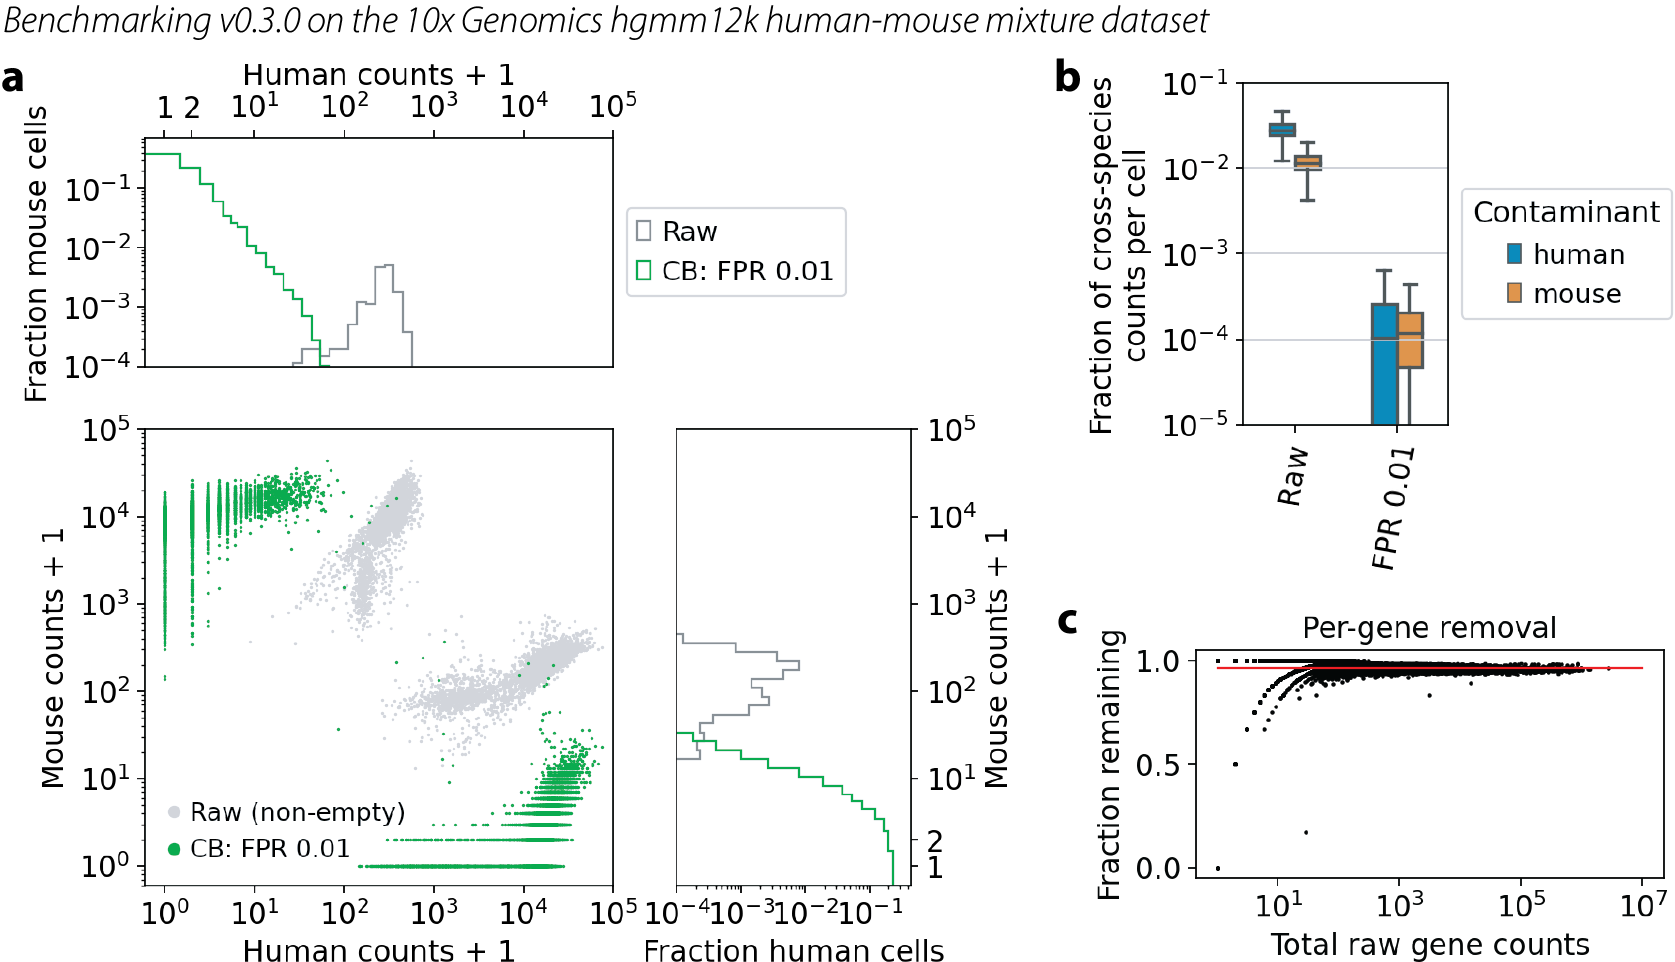
This represents a real improvement over the results published in the paper.
v0.3.2

This appears identical to v0.3.0, as the changes were intended to fix bugs and reduce memory footprint.