Usage
remove-background
Use case
remove-background is used to remove ambient / background RNA from a count matrix,
such as one produced by the 10x Genomics’ CellRanger pipeline.
The output of cellranger count produces a raw .h5 file that is used as the input
for remove-background.
remove-background should be run on a dataset as a pre-processing step, before any downstream
analysis using Seurat, scanpy, your own custom analysis, etc.
The output of remove-background includes a new .h5 count matrix, with background RNA removed,
that can directly be used in downstream analysis in Seurat or scanpy as if it were the raw dataset.
Proposed pipeline
Run
cellranger countor some other quantification tool to obtain a count matrixRun
cellbender remove-backgroundusing the command
cellbender remove-background --cuda --input input_file.h5 --output output_file.h5
Perform per-cell quality control checks, and filter out dead / dying cells, as appropriate for your experiment
Perform all subsequent analyses using the CellBender count matrix. (It is useful to also load the raw data: keep it as a layer in an
anndataobject, for example, see here)
A few caveats and hints:
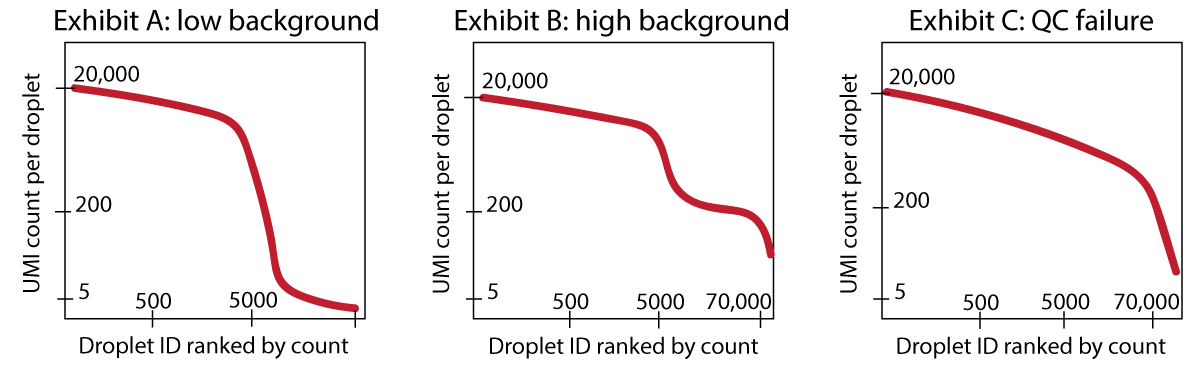
remove-backgroundremoves the background RNA that makes up the “ambient plateau”: the same background RNA contained in empty droplets. If your dataset has extremely few UMI counts in empty droplets, then there is not much background RNA present, andremove-backgroundmay not remove much. See Exhibit A.If you have a dataset where you can identify an “empty droplet plateau” by eye, and these empty droplets have 50 or 100 or several hundred counts, then you can expect
remove-backgroundto clean up your dataset significantly. See Exhibit B.If you have a dataset with so much background RNA that you cannot identify the “empty droplet plateau” yourself by eye, then
remove-backgroundwill also likely have a difficult time. Running the algorithm might be worth a try, but you should strongly consider re-running the experiment, as this points to a real QC failure.
Example
Pre-requisites:
raw_feature_bc_matrix.h5: A raw h5 count matrix file produced by cellranger count. (In CellRanger v2 this file was calledraw_gene_bc_matrices_h5.h5).
Run remove-background on the dataset using the following command
(leave out the flag --cuda if you are not using a GPU… but you should use a GPU!):
(cellbender) $ cellbender remove-background \
                 --cuda \
                 --input raw_feature_bc_matrix.h5 \
                 --output output.h5
(The output filename “output.h5” can be replaced with a filename of choice.)
This command will produce nine output files:
output_report.html: HTML report including plots and commentary, along with any warnings or suggestions for improved parameter settings.output.h5: Full count matrix as an h5 file, with background RNA removed. This file contains all the original droplet barcodes.output_filtered.h5: Filtered count matrix as an h5 file, with background RNA removed. The word “filtered” means that this file contains only the droplets which were determined to have a > 50% posterior probability of containing cells.output_cell_barcodes.csv: CSV file containing all the droplet barcodes which were determined to have a > 50% posterior probability of containing cells. Barcodes are written in plain text. This information is also contained in each of the above outputs, but is included as a separate output for convenient use in certain downstream applications.output.pdf: PDF file that provides a standard graphical summary of the inference procedure.output.log: Log file produced by thecellbender remove-backgroundrun.output_metrics.csv: Metrics describing the run, potentially to be used to flag problematic runs when using CellBender as part of a large-scale automated pipeline.ckpt.tar.gz: Checkpoint file which contains the trained model and the full posterior.output_posterior.h5: The full posterior probability of noise counts. This is not normally used downstream.
If you are interested in saving space and you do not need to re-run cellbender,
only the output_report.html and the output.h5 need to be stored. The
ckpt.tar.gz in particular is a large file which can be deleted to save disk
storage space. (However, if you keep this checkpoint file, it can be used to
create a new output count matrix with a different --fpr, without
needing to re-run the lengthy training process. Simply run the command again
with a different --fpr and specify --checkpoint ckpt.tar.gz.)
Quality control checks
Check the log file for any errors or warnings.
Check lines 13-21 in the log file. Ensure that the automatically-determined priors for cell counts and empty droplet counts match your expectation from the UMI curve. Ensure that the numbers of “probable cells”, “additional barcodes”, and “empty droplets” are all nonzero and look reasonable.
Look at the HTML report and note any warnings it gives. The report will give advice for re-running the tool if appropriate.
Examine the PDF output.
Look at the upper plot to check whether it appears that the inference procedure has converged.
remove-backgrounddoes not implement automatic early stopping, and it will not extend the number of epochs automatically. If you see large downward dips of the ELBO value where it is not monotonically increasing (apart from noise), then try reducing the learning rate by a factor of 2. If the value of the ELBO appears not to have converged to a reasonably stable value, then re-running with more epochs would be recommended. Do not exceed 300, as a rule of thumb.Check the middle plot to see which droplets have been called as cells. A converged inference procedure should result in the vast majority of cell probabilities being very close to either zero or one. If the cell calls look problematic, check the help documentation. Keep in mind that
remove-backgroundwill output a high cell probability for any droplet that is unlikely to be drawn from the ambient background. This can result in a large number of cells called. The appropriate workflow would then be to filter cells downstream for things like mitochondrial read fraction. This will remove some dying, low-expressing cells.The lower plot shows a two-dimensional (PCA) projection of the inferred latent variable
zthat encodes gene expression. Clusters inz-space often correspond to different cell types. If you see clustering in this plot, this is a good sign. A lack of clustering could be due to a dataset that has only one cell type, or it could indicate QC problems with the dataset. (For instance, if cells were all ruptured, all cells would appear to be the same “type”. This would coincide with difficulties in calling which droplets contain cells.)
Create some validation plots of various analyses with and without
cellbender remove-background. One convenient way to do this is inscanpy, storing the raw count matrix and the background-removed count matrix as separate “layers”.UMAPs with and without CellBender (on the same set of cell barcodes)
Marker gene dotplots and violin plots before and after CellBender (you should see less background noise)
Directly subtract the output count matrix from the input count matrix and take a close look at what was removed.
Recommended best practices
The default settings are good for getting started with a clean and simple dataset like the publicly available PBMC dataset from 10x Genomics.
As of v0.3.0, users will typically not need to set values for --expected-cells
or --total-droplets-included, as CellBender will choose reasonable values
based on your dataset. If something goes wrong with these defaults, then you can
try to input these arguments manually.
Considerations for setting parameters:
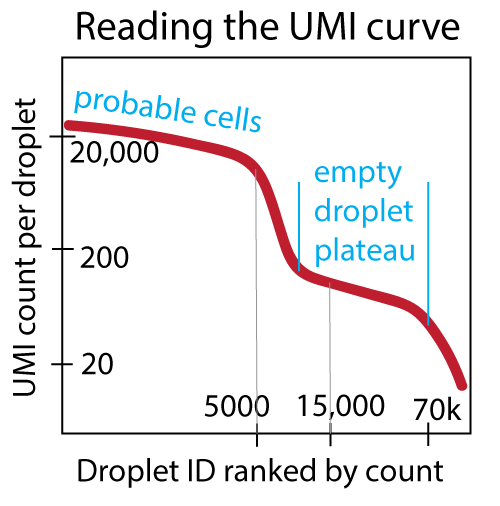
--epochs: 150 is typically a good choice. Look for a reasonably-converged ELBO value in the output PDF learning curve (meaning it looks like it has reached some saturating value). Though it may be tempting to train for more epochs, it is not advisable to over-train, since this increases the likelihood of over-fitting. (We regularize to prevent over-fitting, but training for more than 300 epochs is too much.)--expected-cells: Base this on either the number of cells expected a priori from the experimental design, or if this is not known, base this number on the UMI curve as shown below, where the appropriate number would be 5000. Pick a number where you are reasonably sure that all droplets to the left on the UMI curve are real cells.--total-droplets-included: Choose a number that goes a few thousand barcodes into the “empty droplet plateau”. Include some droplets that you think are surely empty. But be aware that the larger this number, the longer the algorithm takes to run (linear). See the UMI curve below, where an appropriate choice would be 15,000. Every droplet to the right of this number on the UMI curve should be surely-empty. (This kind of UMI curve can be seen in theweb_summary.htmloutput fromcellranger count.)--cuda: Include this flag. The code is meant to be run on a GPU.--learning-rate: The default value of 1e-4 is typically fine, but this value can be adjusted if problems arise during quality-control checks of the learning curve (as above).--fpr: A value of 0.01 is the default, and represents a fairly conservative setting, which is appropriate for most analyses. In order to examine a single dataset at a time and remove more noise (at the expense of some signal), choose larger values such as 0.05 or 0.1. Bear in mind that the value 1 represents removal of (nearly) every count in the dataset, signal and noise. You can generate multiple output count matrices in the same run by choosing several values: 0.0 0.01 0.05 0.1